Unit 1 Prosperity, inequality, and planetary limits
1.2 History’s hockey stick
Living standards throughout the world have risen dramatically since the time of Ibn Battuta—but much more in some countries than in others.
Listen to Diane Coyle talking about the benefits and limitations of measuring GDP. You can learn about how GDP is calculated in The Economy 2.0: Macroeconomics. In order to compare average living standards across countries and over time, economists use the concept of purchasing power parity (PPP) to account for the differences in prices of goods and services. PPPs are price indices that measure how much it costs to purchase a basket of goods and services compared to how much it costs to purchase the same basket in a reference country in a particular year, such as the United States in 2011.
- gross domestic product (GDP)
- A measure of the market value of the output of final goods and services in the economy in a given period. GDP combines in a single number all the output (or production) carried out by the firms, non-profit institutions, and government bodies within a government’s territory. Output of intermediate goods that are inputs to final production is excluded to prevent double counting. Household production is part of GDP if it is sold. GDP is measured monthly, quarterly, and annually.
Figure 1.1 tells only a part of the story. To compare living standards in each country, we start from a measure called gross domestic product (GDP). GDP is a measure of how much is produced in a particular country in a year. We refer to GDP as the ‘output’ of a country. Diane Coyle, an economist, says it ‘adds up everything from nails to toothbrushes, tractors, shoes, haircuts, management consultancy, street cleaning, yoga teaching, plates, bandages, books, and the millions of other services and products in the economy’.1 These are all added together using their market values, which gives us total output, which also corresponds to the total income of everyone in the country. Then we divide GDP by the total population, and use the resulting number—GDP per capita—to measure average income, or ‘living standards’. (Some important things have been left out here. We discuss them in the extension of this section.)
In Figure 1.1, the height of each line is an estimate of average living standards at the date on the horizontal axis. You can see, for example, that in the fourteenth century, living standards were higher in Italy than in any of the other countries for which we have data.

History’s hockey stick
Figure 1.1 History’s hockey stick: gross domestic product per capita in five countries (1000–2018).
Stephen Broadberry. 2021. ‘Accounting for the great divergence: recent findings from historical national accounting’.; Total Economy Database.; S. N. Broadberry, B. Campbell, A. Klein, M. Overton, and B. van Leeuwen, B. 2015. British Economic Growth, 1270–1870. Cambridge: Cambridge University Press.; S. Broadberry, H. Guan, and D. Li. 2018. ‘China, Europe and the Great Divergence: A Study in Historical National Accounting’ Journal of Economic History 78: pp. 955–1000.; J. P. Bassino, S. Broadberry, K. Fukao, B. Gupta, and M. Takashima, M. 2019. ‘Japan and the Great Divergence, 730–1874’ Explorations in Economic History 72: pp. 1–22.; S. Broadberry, J. Custodis, and B. Gupta, B. 2015. ‘India and the Great Divergence: An Anglo-Indian Comparison of GDP per Capita, 1600–1871’ Explorations in Economic History 55: pp. 58–75.; P. Malanima. 2011. ‘The Long Decline of a Leading Economy: GDP in Central and Northern Italy, 1300–1913’. European Review of Economic History 15: pp. 169–219.; S. Broadberry and L. Gardner. 2022. ‘Economic Growth in Sub-Saharan Africa, 1885–2008: Evidence From Eight Countries’. Explorations in Economic History 83: 101424.
Note: The historical data is being improved continuously and the best data is provided in Figure 1.1 for the six countries shown. An alternative source of data is available for many more countries in the interactive chart.
We call these figures ‘hockey stick curves’ because of their resemblance to the shape of an ice hockey stick.
By 2018, according to this measure, people were six times better off, on average, in Japan than in India. People in Japan were nearly as rich as those in Britain, just as they were in the fourteenth century, but people in the US (not shown) were even better off, and people in Norway (also not shown) are better off still.
Before 1300, we have very few data points. For example, we have estimates of Chinese GDP only in 1000, 1090, and 1120, so the graph is drawn by joining these points with straight lines.
We can draw the graph in Figure 1.1 because of the work of Angus Maddison, who dedicated his working life to finding the scarce data needed to make useful comparisons of how people lived across more than 1,000 years. More recent estimates by economic historians are shown in the figure. This book will show you that the starting point of all economics is data like this about regions of the world, and the people in it.
History’s hockey stick does not appear in all countries and, where it does, it is shaped differently for different countries. The hockey stick kink is less abrupt in Britain, where growth began around 1650, while in Japan the kink is sharper, occurring around 1870. In China and India, living standards declined during the period when growth was taking off for countries in western Europe, and the kinks happened much later—in the second half of the twentieth century.
In some economies, including those of China and India, substantial improvements in people’s living standards did not occur before they gained independence from colonial rule or interference by European nations.
Figure 1.1 also illustrates that for much of history, living standards did not grow in any sustained way. When sustained growth occurred, it began at different times in different countries, leading to vast differences in living standards between countries around the world. Since late in the twentieth century, ‘latecomers’ such as India and China have been catching up with the richer nations, but in some countries the hockey stick has not yet tipped upwards.
An entertaining video by Hans Rosling, a statistician, shows how some countries got richer—and healthier—much earlier than others.
Understanding why over the past three centuries some countries have prospered and others have not has been one of the most important questions that economists have asked, starting with a founder of the field, Adam Smith. He gave his most important book the title An Inquiry Into the Nature and Causes of the Wealth of Nations.2 Read more in the ‘Great economist’ feature on Adam Smith.
Great economists Adam Smith
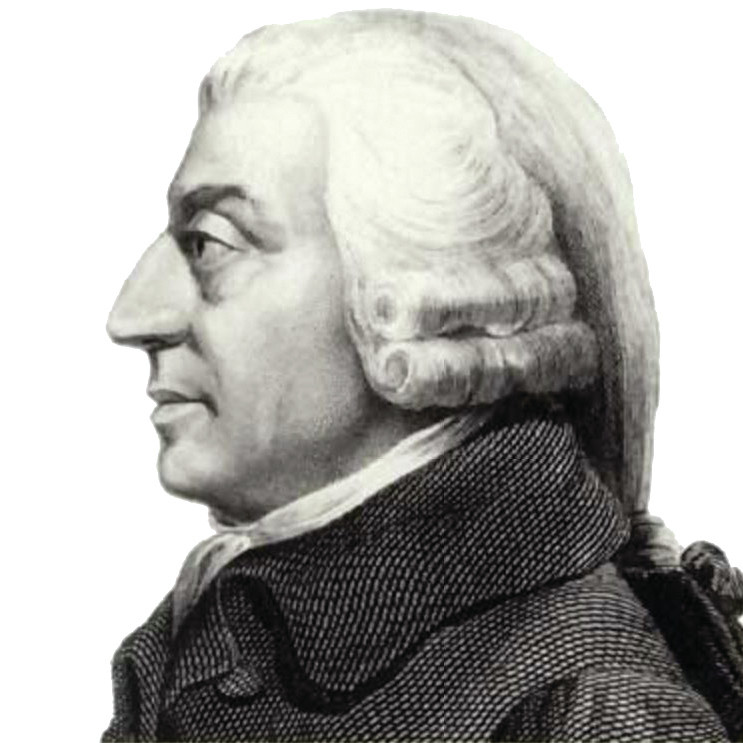
Adam Smith (1723–1790) is considered by many to be the founder of modern economics. Raised by a widowed mother in Scotland, he went on to study philosophy at the University of Glasgow, which was an important centre of Enlightenment thought as well as of colonial trade—both of which influenced his understanding of the economy. He travelled throughout Europe, and while in Toulouse, France, he claimed to have ‘very little to do’ and so began ‘to write a book in order to pass away the time’. This was to become the most famous book in economics.
In An Inquiry Into the Nature and Causes of the Wealth of Nations, published in 1776, Smith asked: How can society coordinate the independent activities of large numbers of economic actors—producers, transporters, sellers, consumers—often unknown to each other and widely scattered across the world? His radical claim was that coordination among all of these actors might spontaneously arise, without any person or institution consciously attempting to create or maintain it. This challenged previous notions of political and economic organization, in which rulers imposed order on their subjects.
Even more radical was his idea that this could take place as a result of individuals pursuing their self-interest: ‘It is not from the benevolence of the butcher, the brewer, or the baker that we expect our dinner, but from their regard to their own interest,’ he wrote.
Elsewhere in The Wealth of Nations, Smith introduced one of the most enduring metaphors in the history of economics: that of the invisible hand. The businessman, he wrote, ‘intends only his own gain, and he is in this, as in many other cases, led by an invisible hand to promote an end which was no part of his intention. Nor is it always the worse for the society that it was no part of it. By pursuing his own interest he frequently promotes that of the society more effectually than when he really intends to promote it.’ And he added: ‘Nobody but a beggar chooses to depend chiefly upon the benevolence of his fellow-citizens.’
Among Smith’s insights is the idea that a significant source of prosperity is the division of labour, or specialization, and that this in turn is constrained by the ‘extent of the market’. Smith illustrated this idea in a famous passage on the pin factory by reporting that ten men, each fully specialized in one or two of 18 distinct operations, could produce close to 50,000 pins a day. But ‘if they had all wrought [pins] separately and independently … they certainly could not each of them have made twenty, perhaps not one pin in a day.’
But such an enormous number of pins could only find buyers if they were sold far from their point of production. Hence specialization was fostered by the construction of navigable canals and the expansion of foreign trade. And the resulting prosperity itself expanded the ‘extent of the market’, in a virtuous cycle of economic expansion.
Smith did not think that people were guided entirely by self-interest. Seventeen years before The Wealth of Nations, he had published a book about ethical behaviour called The Theory of Moral Sentiments.3
He also understood that the market system had some failings, especially if sellers banded together so as to avoid competing with each other. ‘People in the same trade seldom meet together,’ he wrote, ‘even for merriment and diversion, but the conversation ends in a conspiracy against the public; or in some contrivance to raise prices.’
He specifically targeted monopolies that were protected by governments, such as the British East India Company, that not only controlled trade between India and Britain, but also administered much of the British colony there.
He agreed with his contemporaries that a government should protect its nation from external enemies, and ensure justice through the police and the court system. He also advocated government investment in education, and in public works such as bridges, roads, and canals.
Question 1.1 Choose the correct answer(s)
Read the following statements about Adam Smith and choose the correct option(s).
- He agreed with his contemporaries that the government should protect the nation from external enemies and ensure justice through the police and the court system, and also advocated government investment in education and public works.
- Adam Smith understood that the market system had some failings, especially when sellers colluded (‘banded together’) to create market power.
- He didn’t believe that self-interest was the sole motivation of economic agents, and he wrote about ethical behaviour in The Theory of Moral Sentiments, published in 1759.
- This statement expresses Adam Smith’s idea of the ‘invisible hand’: ‘It is not from the benevolence of butcher, the brewer, or the baker that we expect our dinner, but from their regard to their own interest, led by an invisible hand to promote an end which was no part of his intention.’
-
Diane Coyle. 2014. GDP: A Brief but Affectionate History. Princeton, NJ: Princeton University Press. ↩
-
Adam Smith. (1776) 2003. An Inquiry into the Nature and Causes of the Wealth of Nations. New York, NY: Random House Publishing Group. ↩
-
Smith, Adam. 1759. The Theory of Moral Sentiments. London: Printed for A. Millar, and A. Kincaid and J. Bell. ↩
-
Jennifer Robison. 2011. ‘Happiness Is Love – and $75,000’. Gallup Business Journal. Updated 17 November 2011. ↩
