Unit 2 Technology and incentives
How improvements in technology happen, and how they sustain growth in living standards
Before you start
This unit builds on the concepts, models, and analysis of the continuous technological revolution introduced in Unit 1. You should work through Unit 1 before beginning work on this unit.
2.1 Kutesmart automates personalized tailoring
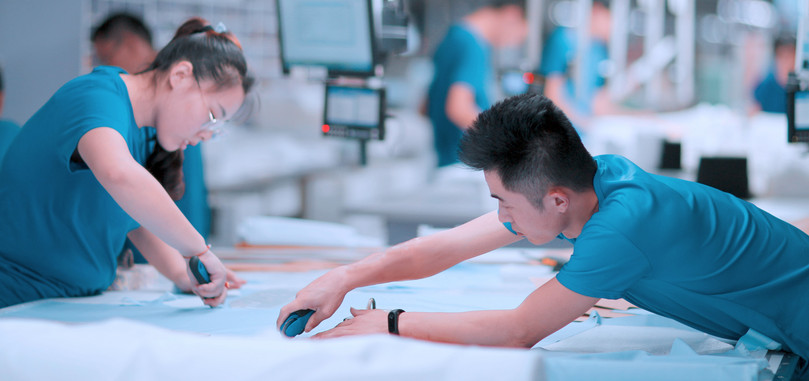
At the end of the last century in Shandong province of China, Zhang Daili owned a firm called Redcollar, which mass produced uniforms. Already in his sixties, he was working hard but not making much money.
The problem was that almost anyone could go into the business—all it took was a few sewing machines and other equipment, along with enough finance to hire relatively unskilled workers. So fierce competition kept prices low and profits paper-thin.
Trying to break away from the pack, in 2014 Zhang came up with both a product new to his firm and a new technology. The product was made-to-measure men’s suits and the new technology combined cutting-edge software with computer-literate workers.
The plan was to produce customized suits—something that only the super-rich could afford at the time. But he would produce them at a fraction of the cost of competitor firms that used labour-intensive, highly skilled, hand-made tailoring. ‘Affordable luxuries’ was what Zhang promised to provide.
Automation began with the customer’s measurements, collected on one of initially ten ‘magic buses’ that visited buyers by appointment. On the bus, customers would change into a disposable sensor-equipped leotard to be measured by a light beam machine. Zhang’s standardized method of ‘coordinates measuring’ uses coordinates of 19 places on the body and can be mastered by anyone without tailoring experience in a week.
At the firm, newly named Kutesmart and now run by his daughter, Zhang Yunlan, they employed digitally savvy, younger, and cheaper-to-hire workers instead of experienced tailors. In traditional tailoring, the pattern-maker would be able to produce patterns for just two garments a day, cutting the pattern to accentuate the client’s best physical features and cover up the worst ones. At Kutesmart, specially written software transferred the body measurements to computer-controlled cutting machines and other stages of production at 480 workstations. Over time, the accumulated Kutesmart database has enabled the ‘flattering’ customization to be replicated.
Zhang Daili’s breakaway strategy worked. The labour time required to custom-make a suit fell to one-twentieth of the time using conventional tailoring methods. The costs of producing made-to-measure suits plummeted.
Kutesmart’s custom-made suits—under a series of labels, including Redcollar, the name of Zhang’s old mass-producing uniform company—were selling for even less than standard off-the-rack suits. As of 2016, Kutesmart revenues were doubling annually. Zhang Yunlan was even thinking that Kutesmart might also go into the software business.
The Industrial Revolution
A drawing and description of the spinning jenny is available on the British Library website.
What the Zhang family accomplished in Shandong province in the early twenty-first century—the development of new products, new technologies, and new ways of organizing production and sales—is a microcosm of what happened three centuries earlier in Britain, in the Industrial Revolution (Figure 1.1). As with the Zhang family, major innovations occurred in textiles, where the most famous inventions involved spinning (traditionally carried out by women, called spinsters), and weaving (traditionally carried out by men). In 1733, John Kay invented the flying shuttle, which greatly increased a weaver’s hourly output. This increased the demand for the yarn that was used in weaving to the point where it became difficult for spinsters to produce sufficient quantities using the spinning wheel technology of the day. James Hargreaves’ spinning jenny, introduced in 1764, was a response to this problem.
Coal played a central role in the Industrial Revolution, and Britain had a lot of it. Prior to the Industrial Revolution, most of the energy used in the economy was ultimately produced by edible plants that convert sunlight into food for both animals and people, or by trees whose wood could be burned or transformed into charcoal. By switching to coal, humans were able to exploit a vast reserve of what is effectively stored sunlight. The cost has been the environmental impact of burning fossil fuels, as we explain in Unit 1.
This wave of technological advances and organizational changes transformed an agrarian and craft-based economy in the grips of the Malthusian trap, into a commercial and industrial economy capable of sustaining continued increases in material living standards.
A well-known economist, Nassau Senior, regarded the famine in Ireland in 1848 (when Irish food supplies had been devastated by potato blight) as a necessary adjustment according to Malthusian logic. He was reported by a horrified Oxford University colleague as saying that ‘he feared the famine of 1848 in Ireland would not kill more than a million people, and that would scarcely be enough to do much good.’
Before the Industrial Revolution, productivity gains from technological progress had been eroded by rising population, which returned living standards to subsistence level (Section 1.7). Malthus’s vicious circle of poverty was widely accepted as inevitable by economists in the early nineteenth century.
But the world was changing. Advances in technology and the increased use of non-renewable resources raised productivity (output per person) more rapidly. And as long as technology improved fast enough, it could outpace the population growth that resulted from the increased income, and break out of the Malthusian vicious circle. Living standards could then rise.
Figure 2.1 shows an index of the average real wage (the money wage, adjusted for changes in prices) of skilled craftsmen in London from 1264 to 2001, plotted together with the population of Britain over the same period. Following a long period of stagnation, wages increased dramatically after 1830, and population and living standards rose together. This period is labelled ‘Escape’ in Figure 2.1. Much later, people would prefer smaller families, even when they earned enough to afford to have a lot of children. This so-called demographic transition happened in Britain around the 1870s, and later in many parts of the world as living standards increased.

Figure 2.1 Real wages over seven centuries: wages of craftsmen (skilled workers) in London (1264–2001), and the population of Britain. Real wages are expressed relative to the real wages in 1850, with the 1850 real wage given a value of 100.
Robert C. Allen. 2001. ‘The Great Divergence in European Wages and Prices from the Middle Ages to the First World War’. Explorations in Economic History 38 (4): pp. 411–447; Stephen Broadberry, Bruce Campbell, Alexander Klein, Mark Overton, and Bas van Leeuwen. 2015. British Economic Growth, 1270–1870. Cambridge University Press.
Index of real wages
The term ‘index’ means the value of some quantitative amount relative to its value at some other time (the reference period) which is usually normalized to 100.
The term ‘real’ means that the money wage (say, six shillings per hour at the time) in each year has been adjusted to take account of changes in prices over time. The result represents the real buying power of the money the workers earned.
The reference year is 1850 in this case, but the curve would have the same shape if any other year had been selected. It would be positioned higher or lower, but would still have the same shape as our familiar hockey stick.
Our model of the adoption of labour-saving technology in the textile industry in the Industrial Revolution can be used to understand the decisions of contemporary entrepreneurs like the Zhang family.
Why did the spinning jenny, the steam engine, and a cluster of other inventions emerge and spread across the economy in Britain at this time? In this unit, we examine one explanation of how these improvements in technology came about, why they first occurred in Britain during the eighteenth century, and how Britain’s dominant position in the world economy contributed to continuous improvements in material living standards, in part due to the markets and enslaved labour in its colonies.
We begin in the next two sections with the fundamental economic concepts that we will use to develop this explanation:
- opportunity costs, economic rents, and incentives, which help to explain how people make economic decisions
- comparative advantage, specialization, and the division of labour, which influence who undertakes what tasks in production, and who produces what.
Question 2.1 Choose the correct answer(s)
Figure 2.1 shows an index of average real wages of skilled workers in London between 1264 and 2001. What can we conclude from this graph?
- The graph shows an index of real wages, where the number 100 represents the real wage in 1850. The index is also approximately 100 in 1408, so real wages were roughly at the same level they were in 1850, but we cannot infer what the money wage was.
- The wages graphed are real wages, so are adjusted to take account of changes in prices.
- Check the scale on the vertical axis: while the graph looks fairly constant between 1264 and 1850 compared to the rapid increase since 1850, the average real wage actually almost doubled and then halved again between 1264 and 1600.
- In 1850, the real wage index was 100. By 2001, the index had increased by roughly six times that value, to more than 650.
How to cite this unit
Margaret Stevens, Samuel Bowles, Wendy Carlin, and Olivia Osei-Twumasi. (2023). ‘Technology and incentives’. Unit 2 in The CORE Econ Team, The Economy 2.0: Microeconomics. Available at https://books.core-econ.org/the-economy/microeconomics/02-technology-incentives-01-kutesmart-tailoring.html. [Accessed on (date)].
