Unit 8 Economic dynamics: Financial and environmental crises
8.9 Leverage and interconnection: The vulnerabilities of banks
The global financial crisis of 2007–2009 was set off by a house price boom and bust in the US of the type described in the previous three sections. The last step in understanding what happened in the financial crisis is to understand how banks contributed to and profited from the credit-fuelled housing boom—and why they were so vulnerable to drops in the price of housing.
As set out in Section 6.10, leverage is critical to how banks make profits. They borrow funds from their depositors and in financial markets, and lend or invest at a higher rate of interest. A bank is a very highly leveraged firm with its equity just a small percentage of its assets. Figure 6.15 compares the balance sheet of Barclays bank with that of a non-financial corporation, Honda, in 2023. Barclays’ leverage measured by the ratio of debt to total assets was around 95% (Figure 8.21 shows that this was just above the average for UK banks in that year); Honda’s was 54%. Equivalently, Honda finances its assets by a mixture of debt (54%) and equity (46%), whereas Barclays finances its assets with 95% debt and 5% equity.
In the ‘Economist in action’ video (Exercise 8.7), economist Anat Admati explains that just as leveraged households are vulnerable to a fall in the price of housing, banks are vulnerable to a fall in the value of their assets. Government regulation to require banks to hold more equity reduces the risk of insolvency. This forces banks to shoulder more of the risk of their business decisions, reducing the external effects and the costs to taxpayers of bank bailouts, to which we return below.
Exercise 8.7 Banking regulations can help bring on financial crises
An ‘Economist in action’ video shows Anat Admati, an economist, explaining the problems with the regulation of the banking system.
In our ‘Economist in action’ video, Anat Admati explains the basic principles of equity and debt. Anat explains how banks operate with low equity and create a high risk lending environment. She argues how regulation is essential to control excessive risk and protect against financial crises.
- Using housing prices as an example, explain the upsides and downsides of leverage.
- According to the video, what is the key difference between banks and other corporations, and why is this dangerous for the banking system?
- What are some factors that contribute to the fragility and riskiness of the banking system, and how can we prevent future financial crises from occurring?
Investment banks are also referred to as shadow banks because they are not covered by the stricter regulatory regime that applies to commercial banks.
Leverage increased in US investment banks and in UK banks in the years before the collapse of Lehman Brothers. Figure 8.21 shows the leverage of US and UK banks. The two series refer to the ‘big 4’ commercial banks and the ‘big 5’ investment banks, one of which was Lehman Brothers. The activities of the investment banks had expanded greatly in the credit boom that preceded the financial crisis.

Figure 8.21 Leverage of US and UK banks (1980–2023).
Federal Reserve Financial Accounts of the United States. FRED. Bank of England Financial Stability Report, December 2023.
Why is the banking system unstable?
The trigger for panic about the collapse of the global banking system was the failure of a US bank—Lehman Brothers—viewed at the time as too small to cause a systemic problem.
On the day it failed, Lehman reported assets of $639 billion. By way of comparison, JPMorgan Chase’s assets were over $2 trillion. Yet the Lehman Brothers’ insolvency triggered a global financial crisis. It turned out to be ‘too connected to fail’ in an orderly manner. Banks are often highly interconnected through their lending and trading activities. Moreover, if they become exposed to similar kinds of risk, such as the mortgage-linked financial products that had proliferated in the US and triggered Lehman’s losses, they may also become indirectly connected and hence vulnerable to contagion.
Contagion works in the following way: When Lehman filed for bankruptcy, market participants suspected that other banks could be in trouble as well. Banks became reluctant to lend to each other in the interbank market where banks do their very short-term lending and borrowing. Banks seek to maximize their profits by keeping their liquid assets (currency and bank reserves) as low as possible consistent with prudential regulation because they earn low or zero interest on them. The interbank market is crucial to managing their liquidity and banks renew their short-term borrowing every night, as Lehman did. This means they repay loans taken out the previous day and take out new ones. The result of the loss of confidence in other banks made it impossible to take out new loans (‘roll over’ the loans). This shortage of liquidity in the interbank market—referred to as a ‘freezing up’ of the market—meant that even sufficiently capitalized, solvent banks were at risk of not receiving the short-term funding they needed to have the liquid assets they required to carry out their day-to-day business.
Banks tried to generate cash by selling assets. This was the best each bank could do for itself. But given that others were doing the same, it was disastrous for banks taken as a whole. With all banks trying to offload similar assets as fast as they could, asset prices fell sharply, which generated further losses for the banks. Just as we saw for the forced sale of houses following widespread repossessions, these fire sales of assets created a positive feedback process in the financial system, in which the initial fall in asset prices produced a further fall in the same direction.
Hence, the Lehman failure triggered large-scale losses and disruptions in the financial system, which eroded confidence in other financial institutions, threatening their failure. Not just one country, but the global financial system, was affected.
Exercise 8.8 uses an animation to explain the behaviour of households, banks, and the government in the events leading up to the crisis and the consequences of their behaviour.
Exercise 8.8 Behaviour in the financial crisis
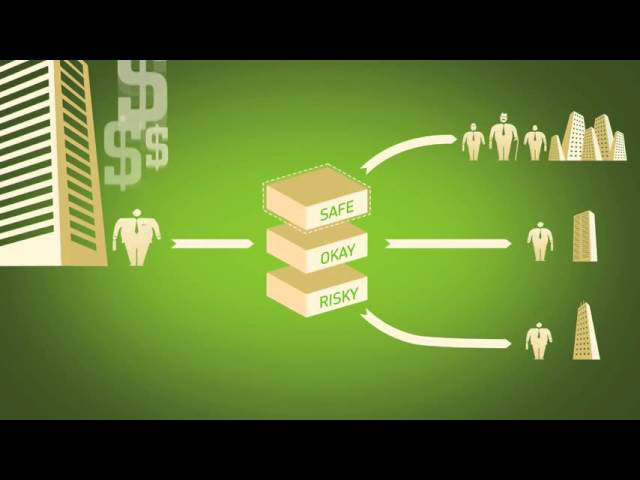
Note that the imagery in this visualization uses stereotypes about gender and social class in a way that would not be acceptable for a modern pedagogical tool in 2024. It is very much a product of its time.
‘The Crisis of Credit Visualized’ is an animated explanation of the behaviour of households and banks in the housing boom and the financial crisis. Remember that the financial crisis originated in the US, sparked off by the bust in the housing market.
- Use the models discussed in this unit to explain the story told in the video.
- Are there parts of the video that you cannot explain using the models and concepts from this unit?
